The chart axes options enable users to set formatting preferences for the primary and secondary y-axis, and the x-axis. These options are available for Cartesian and plotted charts.
Note: The x-axis is typically the categorical axis, with the positions along this axis representing distinct categories.
Axis Formatting Panel
Apply formatting changes to x- or y-axes from the Formatting panel.
Labels
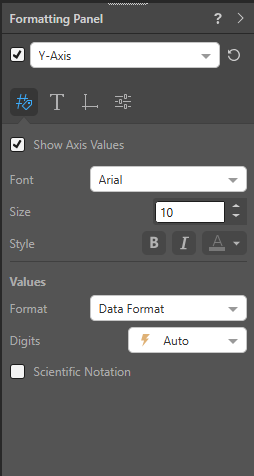
Show or hide values for the given axis and adjust fonts and value formats.
Styles
- Show Axis Values: Select this checkbox to show axis values.
- Font: Change the font type.
- Size: Change the font size.
- Style: Change the font style (bold, italics, or font color, which is changed using the Color Picker).
Direction
(Only supported for the x-axis.) Display the x-axis labels horizontally, vertically, or at a 45-degree angle. Choose Auto to let Pyramid display the labels in the most suitable way given the size of the chart.
Values
(Only supported for the y-axis and secondary y-axis.)
Format
Set the formatting string for the y-axis or secondary y-axis:
- Raw Value: Display the labels as raw values. For example, 100.00, 200.00, and so on.
- Data Format: Set the label format according to the format of the measure in the data model. For example, $100.00, $200.00, and so on.
- Custom: Manually set the required label format.
Digits
Set the units for the labels on the y-axis or secondary y-axis:
- Choose Auto to let Pyramid set the units, or select thousands, millions, or billions.
- Choose Off if you don't want to display units.
Scientific Notation
Select the checkbox to use scientific notation for the values.
Title
Show or hide the title for the given axis, customize the axis title, and adjust its font.
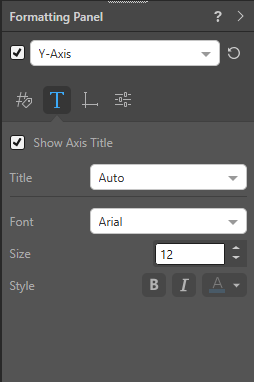
- Show Axis Title: Show a title for the given axis.
- Title: By default, the axis title is its measure or hierarchy. Select Custom to change the axis title.
- Font: Change the font type.
- Size: Change the font size.
- Style: Change the font style (bold, italics, or font color, which is changed using the Color Picker).
Lines
Show or hide the axis line and set the line width, color, and style.
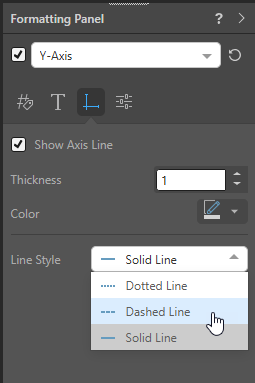
- Show Axis Line: Select this checkbox to show the line on the given axis.
- Thickness: Change the thickness of the axis line.
- Color: Change the axis line color using the Color Picker.
- Line Style: Choose a solid, dashed, or dotted line.
Settings
Which settings are shown depends on which axis you've selected.
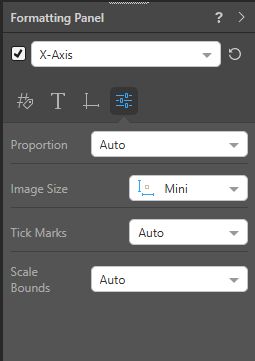
X-Axis Settings
Set the x-axis proportions, adjust size for any URL images on the axes, tick marks, and Scale Bounds.
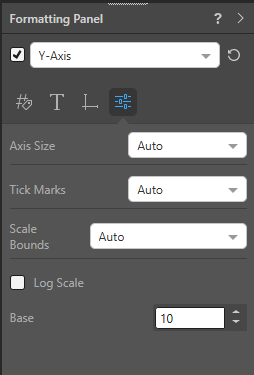
Y-Axis Settings
Set the Axis Size (proportion), tick marks, and Scale Bounds.
Values
Proportion / Axis Size
This field is called Proportion on the x-axis and Axis Size on the y-axis. It Determines the proportion of the visual that is dedicated to the given axis. You may want to change this to optimize viewing of the axis labels.
- Auto: Pyramid will automatically determine the optimal axis proportion.
- Maximum Size: Manually set the maximum size of the axis as a percentage of the visual.
- Fixed Size: Manually set the size of the axis as a fixed number of pixels.
Image Size
The Image Size field is only present for the X-Axis, although the setting actually applies to URL hierarchy images that appear on either axis.
If your Categories, Trellis Vertical, and Trellis Horizontal drop zones include image URL hierarchy chips, you can use this option to adjust the size of the images from that hierarchy on the associated axis. Changing the size value changes the dimensions of the images, making them larger or smaller. Image URLs in other drop zones have a fixed size that is unaffected by this option.
- Click here for more information about Image Sizes
Tick Marks
The tick marks determine the increment of values on the y-axis. For example, a tick interval of 50 will cause the y-axis value labels to increase in increments of 50 (0, 50, 100, 150, 200, 250, and so on); while a tick interval of 200 would mean in increase in increments of 200 (0, 200, 400, 600, and so on).
- Auto: Pyramid will automatically determine the optimal tick interval.
- Custom: Manually set the tick interval according to a given static value (for example, 1000 to increase in increments of 1,000).
Scale Bounds
Sets the lower and upper bounds on the axis.
- Auto: Pyramid will automatically determine the optimal axis bounds.
- Starts from 0 - Optimized: Pyramid will start the axis bounds from 0 unless it determines a better outcome.
- Always starts from 0: Axis will always start on 0.
- Custom: Manually set the lower and upper bounds of the axis.
Log Scale
Select the Log Scale checkbox to apply a logarithmic scale to the Y axis values.
Base
Set the logarithm base to use. The default is base 10.
Note: To set the logarithm to base e, enter the value of e to the precision you require; for example, 2.71828.
Order
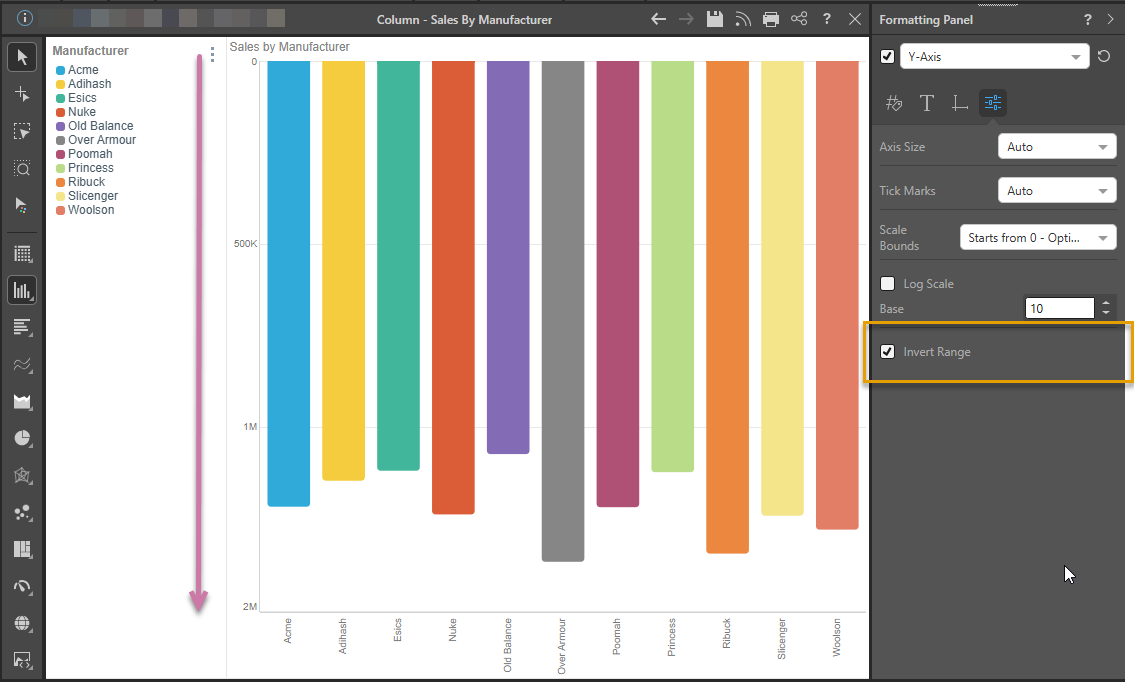
Invert Range (Y-Axis)
When selected, the Invert Range checkbox reverses the y-axis, showing the items in the opposite sequence (typically showing the smallest value at the top of the chart rather than at the x-intersect):
- Select Invert Range to display data in reverse order.
- Clear Invert Range to display data in its original order.
Reverse Order (X-Axis)
When selected, the Reverse Order checkbox reverses the order of the categories on the x-axis, showing the items in the opposite sequence:
- Select Reverse Order to display data in reverse order.
- Clear Reverse Order to display data in its original order.
See below for an example of Reverse Order.
Examples
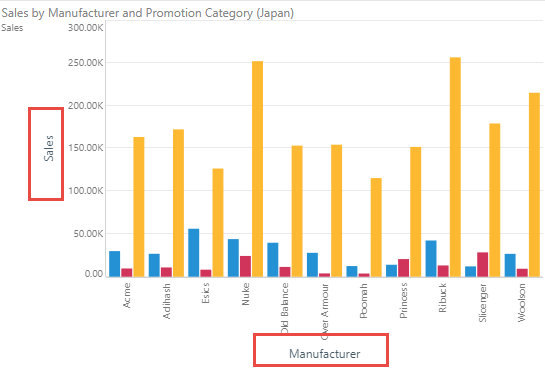
In this example, titles were enabled for both the x- and y-axes:
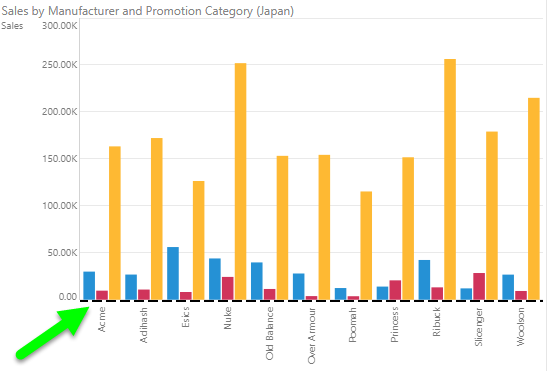
Here, the axis line was adjusted for the x-axis:
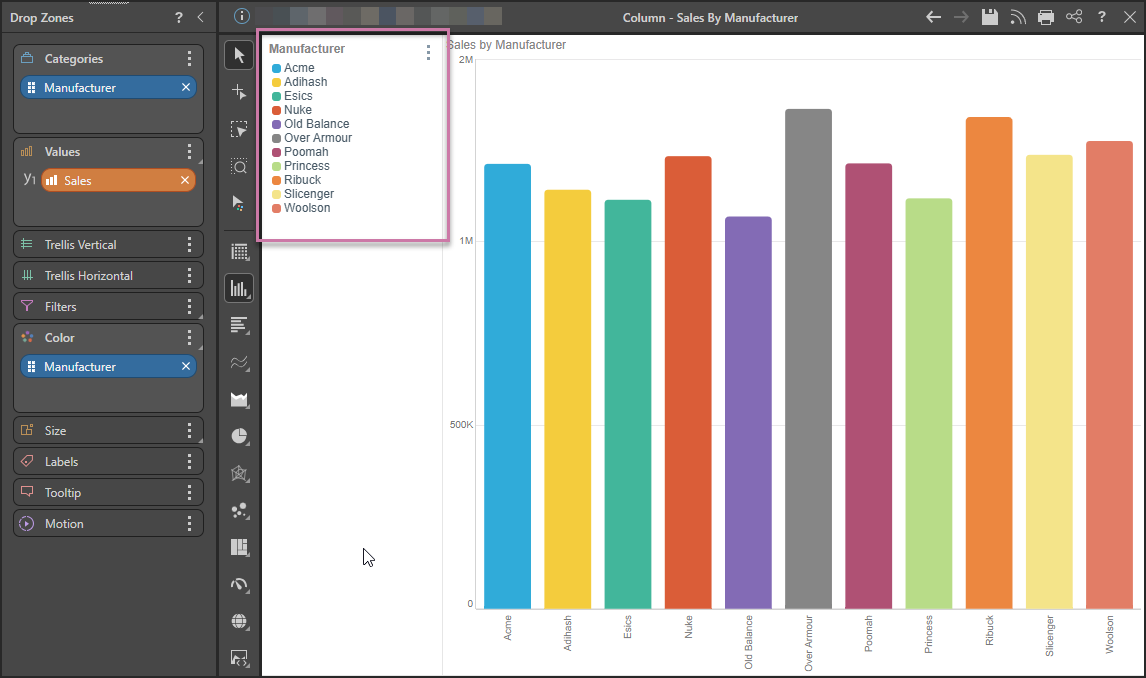
In this example, the Manufacturer Categories are in alphabetical order, which is the default and matches the legend (purple arrow below):
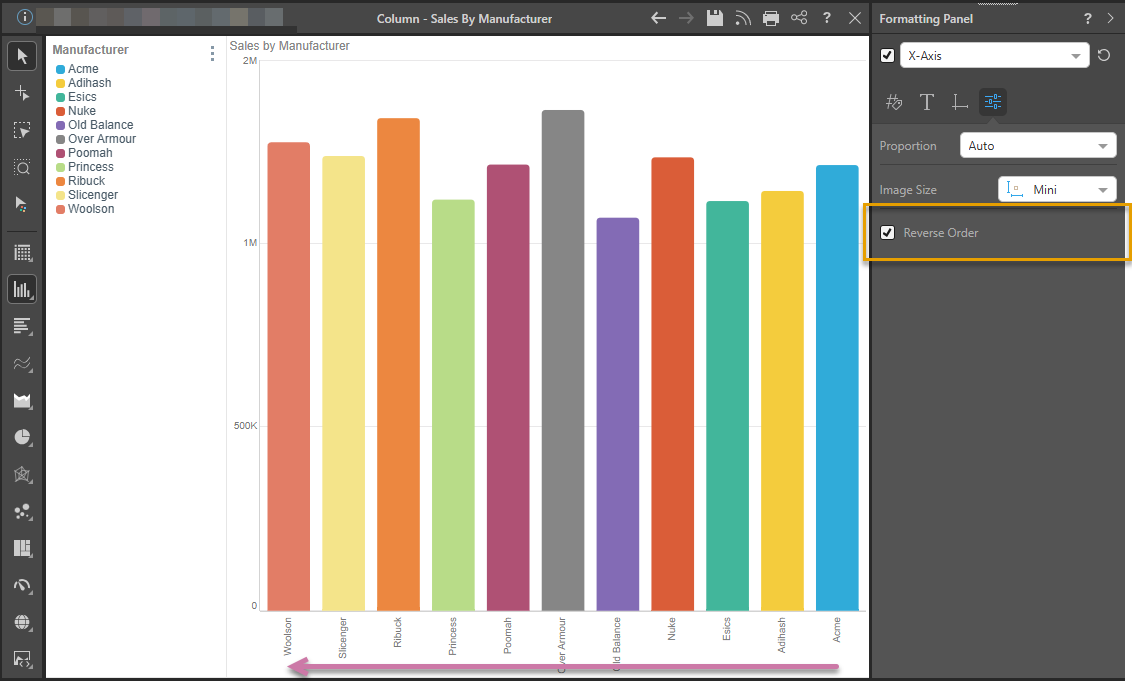
Using the Formatting Panel to reverse the order of the categories on the x-axis (orange highlight below), reverses the order of those categories (purple arrow):
Alternatively, you can use Invert Range to reverse the order of the y-axis: